

Strava Data Wrangling
Strava allows users to download data recorded through their use of the app. Through a simple “Request your archive” function, Stata sends users a comprehensive zip file that records various kinds of information such as the user’s posts, activities, and followers. More information regarding the functionality can be found here.
The precise way Strava records your data allowed me to combine my personal and professional interests to identify patterns, associations, and statistical relationships between the various factors involved in an average run!


Overview of the Data
Overall, the quality of data recorded by Strava is detailed and sufficient such that only a small amount of cleaning steps were necessary.
A few idiosyncrasies noted with the data are:
Any indoor runs recorded typically have many missing data points. If you’re a treadmill runner, replicating such analysis might be difficult!
Activity time does not seem to adjust for local time. Something to keep in mind if you’re a runner that likes to travel.
Many fields associated with body health measurements are missing. Something that can be supplemented with use of running accessories such as an Apple Watch.

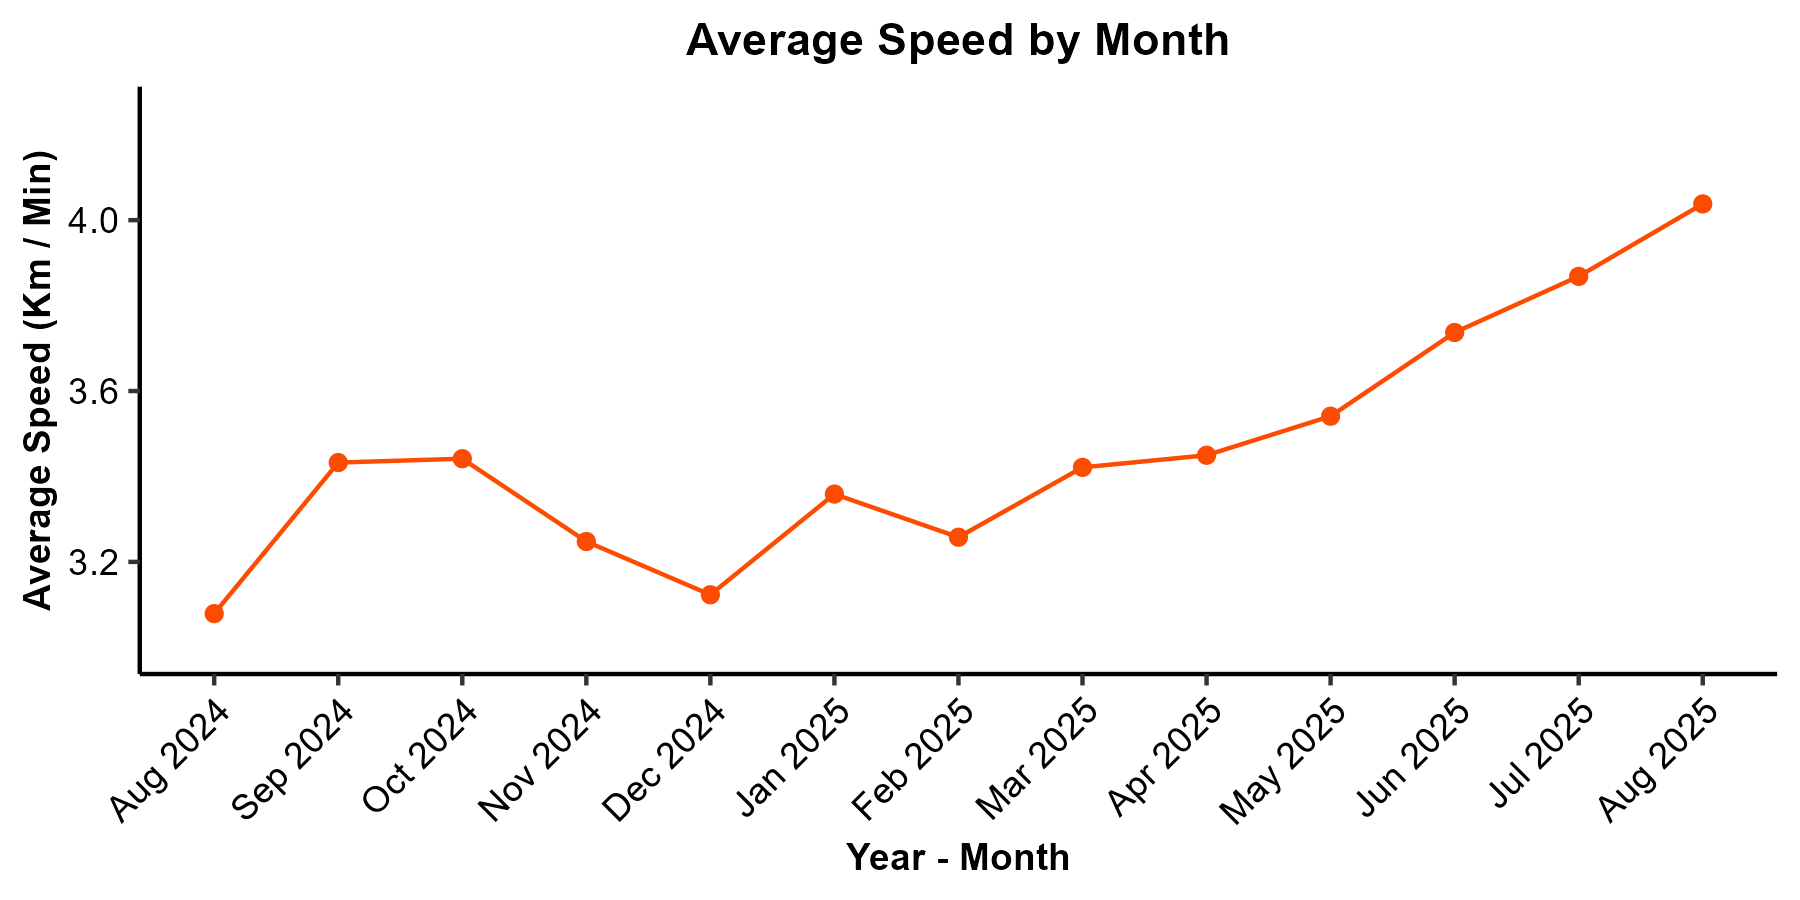
We start off with a progress check!
I first started running seriously in about August 2024 to prepare for the 2024 TCS Waterfront Marathon in April.
Since then, my pace has risen by 31%, from a minimum monthly average speed of 3.07 km/min in August 2024 to a maximum monthly average speed of 4.04 km/min in August 2025.
My pace hasn’t monotonically increased overtime (which isn’t expected - progress is not always linear!). One factor that I can think of that might have caused the decrease in average speed post-October 2024 is the setting of the cold Canadian winters. I investigate this, and other relationships of interest, in the next section!
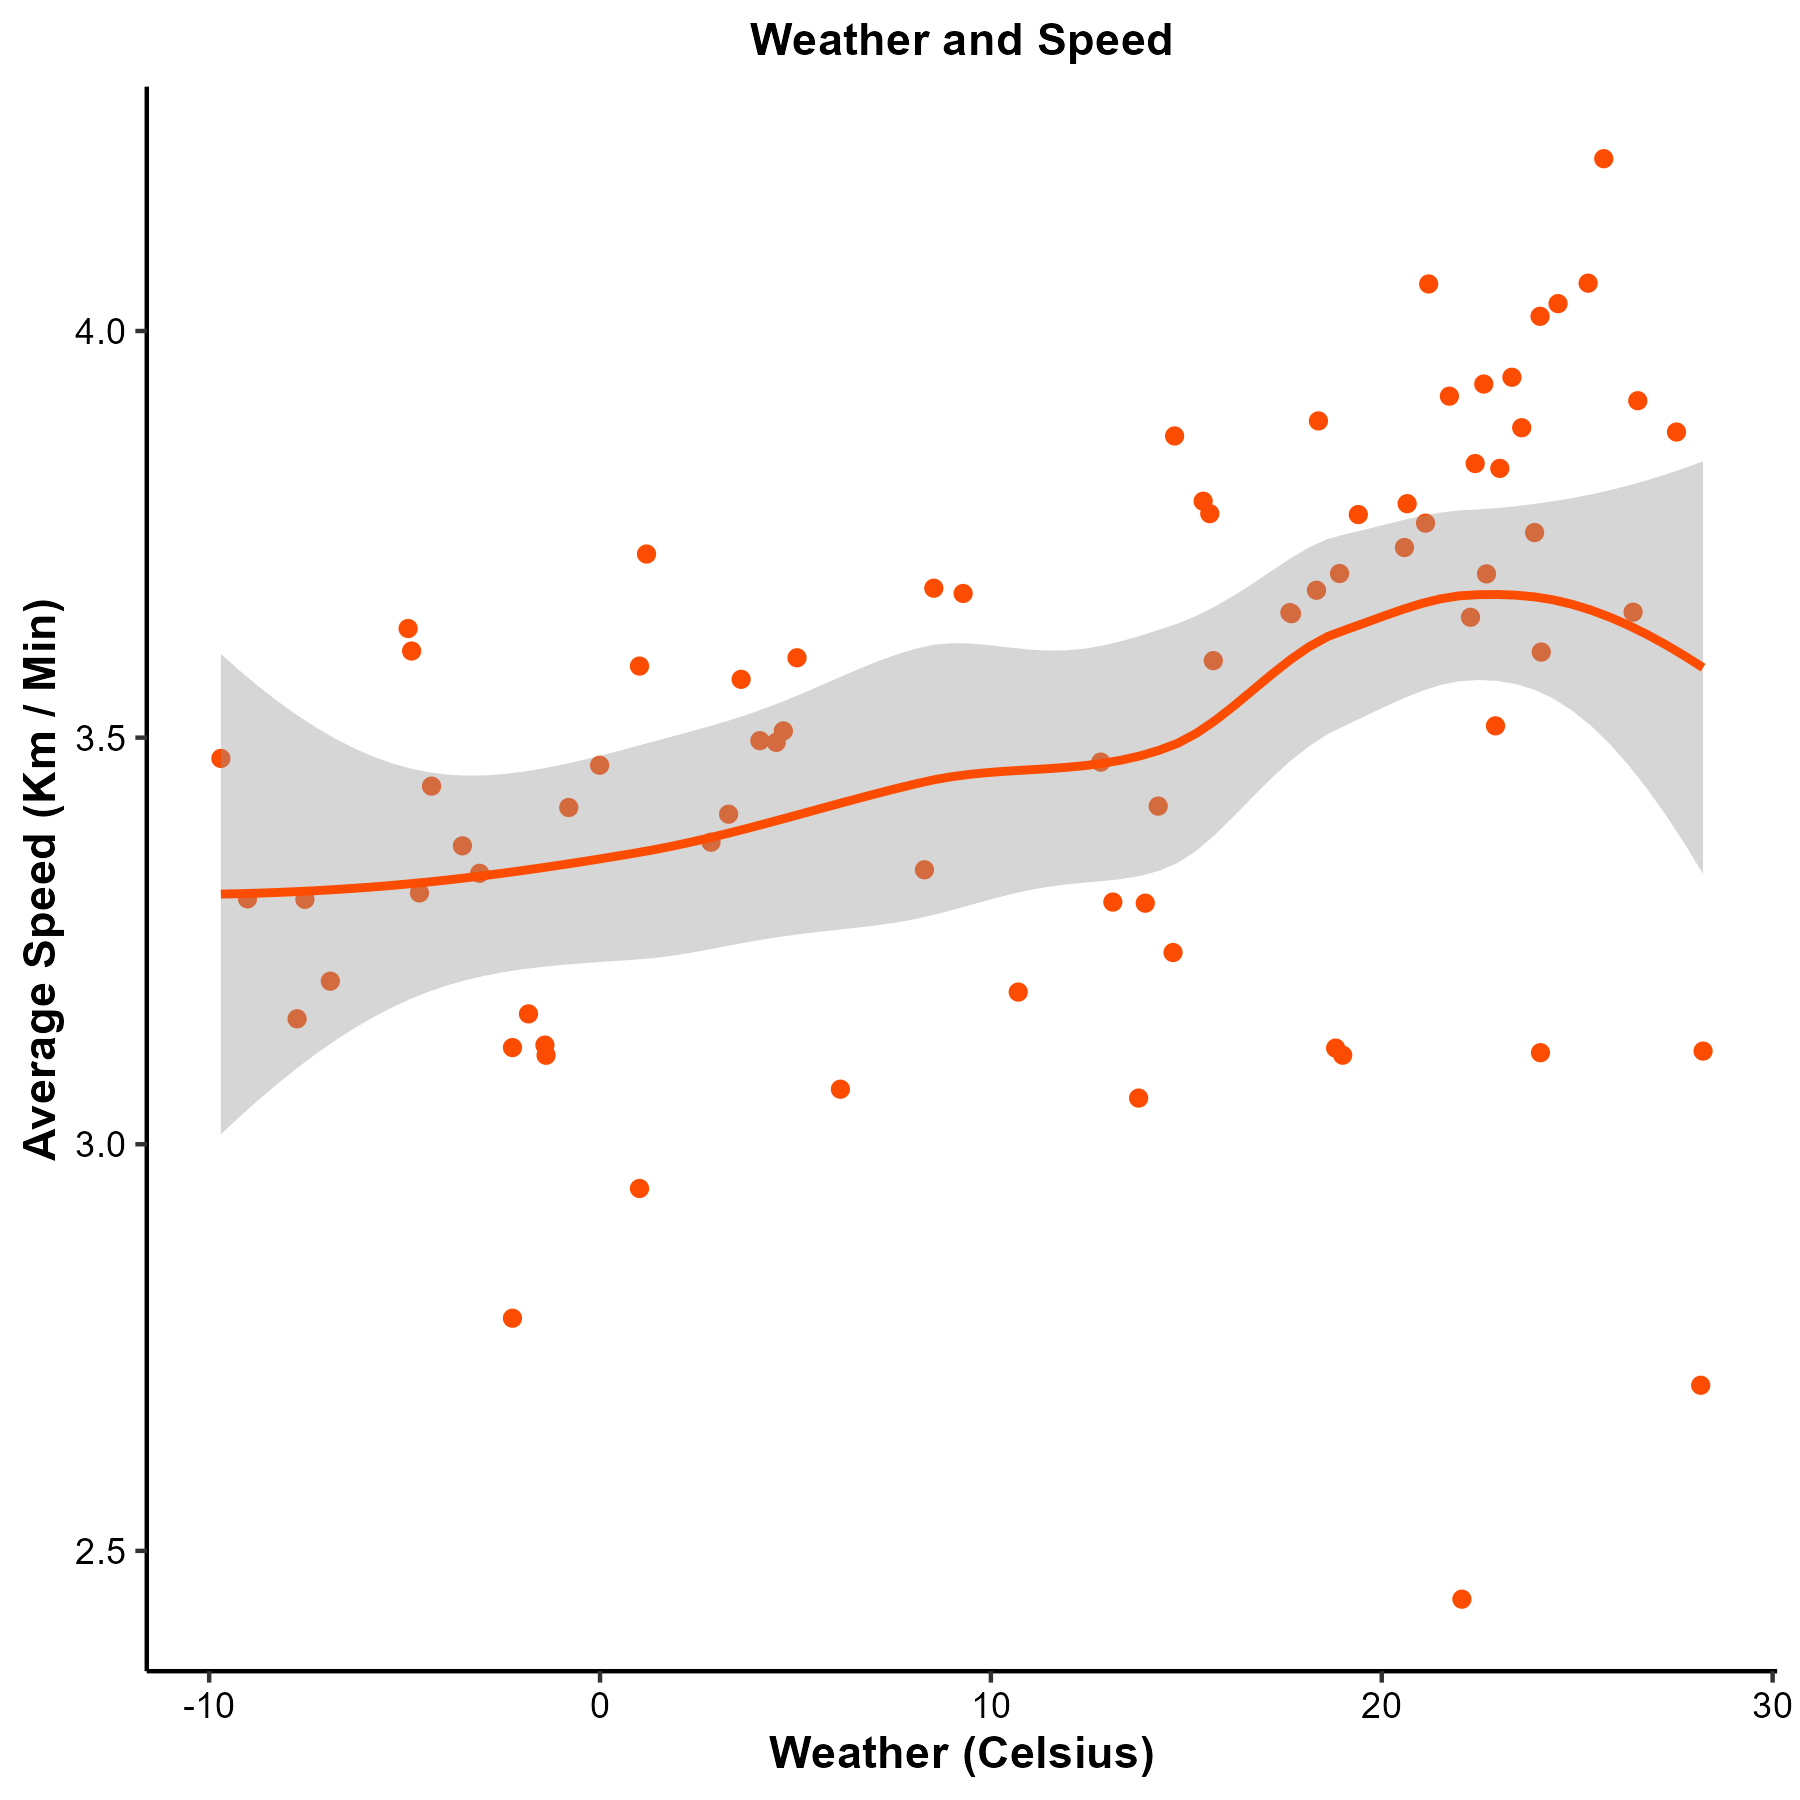
Weather and Speed
It looks like theory about winter slowing down my space holds some water! Weather and speed is observed to be largely negatively correlated. Interestingly, diminishing returns to warmer temperature is also observed. That is - a run in scorching hot weather is also associated with a slower space
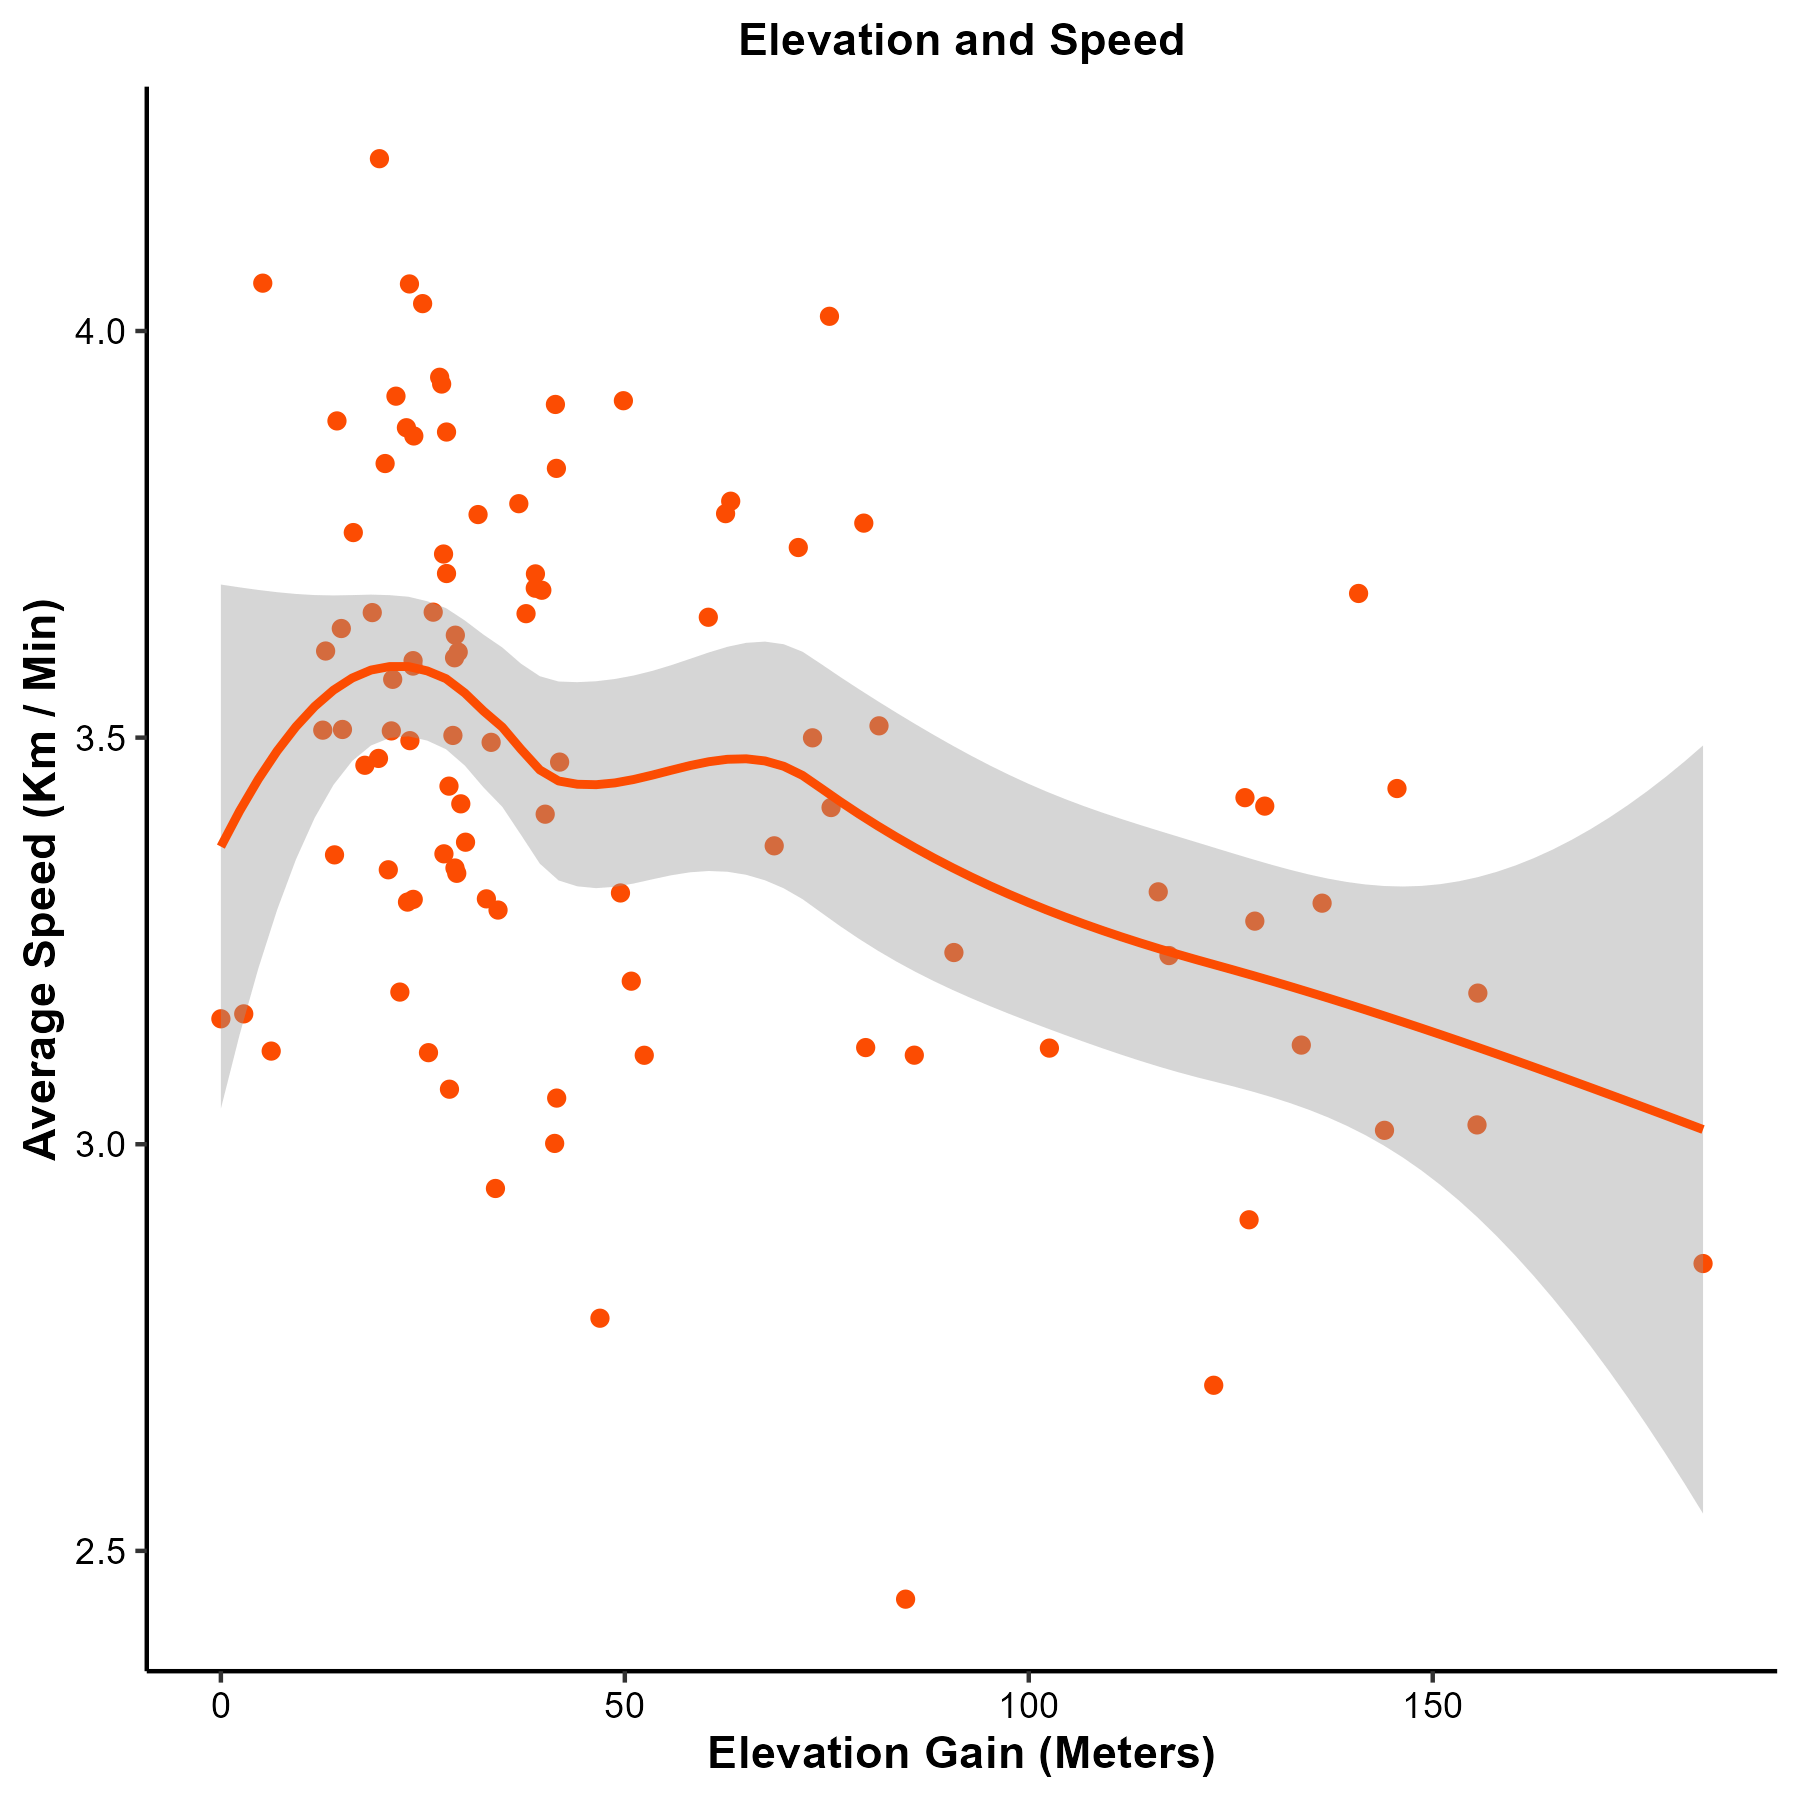
Elevation and Speed
The negative relationship between elevation gain and speed is expected! However, I was interested in seeing to the severity of the negative relationship. It seems the negative relationship isn’t too severe, but I would be interested in how this negative relationship differs across individuals.

City and Speed
I’ve been fortunate enough to travel to multiple cities since August 2024. Whenever I go to a new city, I try to run to light up that heat map. It looks like Seoul has the highest median speed. Could this be attributable to a motherland speed buff?

Time of Day and Speed
Strava assigns by default the activity name based on the start time of each activity. Based on this idiosyncrasy, we can sidestep the issue with activity time and see in which part of the day I’m quickest. Strava defines morning, lunch, afternoon, evening, and night as 00:00-06:00, 6:00-12:00, 12:00-14:00, 14:00-18:00, and 18:00-24:00, respectively.
Regression Estimation
I use a basic multiple regression model to quantify the associative relationships between the factors discussed above and average speed.
This simple model doesn’t serve to establish causality but to see if we can detect statistically significant factors associated with run pace.

Some highlights are…
Some statistically significant relationships we’ve identified is a negative association with elevation and a positive association with temperature
A quadratic term for temperature was included to reflect its diminishing nature on pace, though it does not seem large enough to statistically distinguish it from zero
I thought that distance would have a negative statistically significant effect. However, that does not seem to be the case!